TellUS Report

ESG Dashboard & Visual Trend Analysis

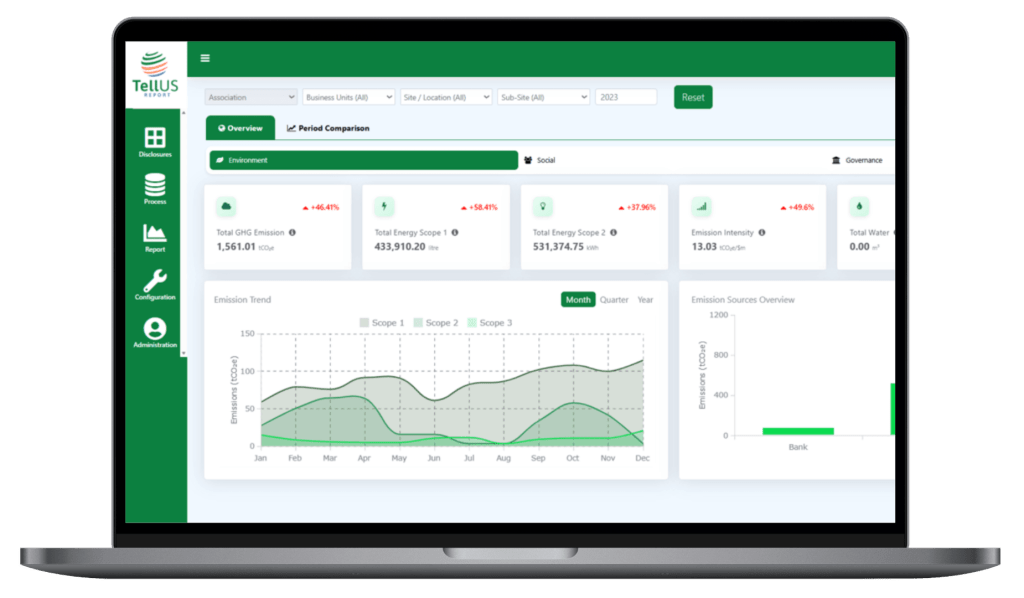
Gain full visibility into your ESG performance with interactive dashboards designed to turn complex data into clear, actionable insights.

Monitor key metrics in real time, analyse trends over time, and compare performance across your organisation — all in one centralised view.

Visual Performance Tracking

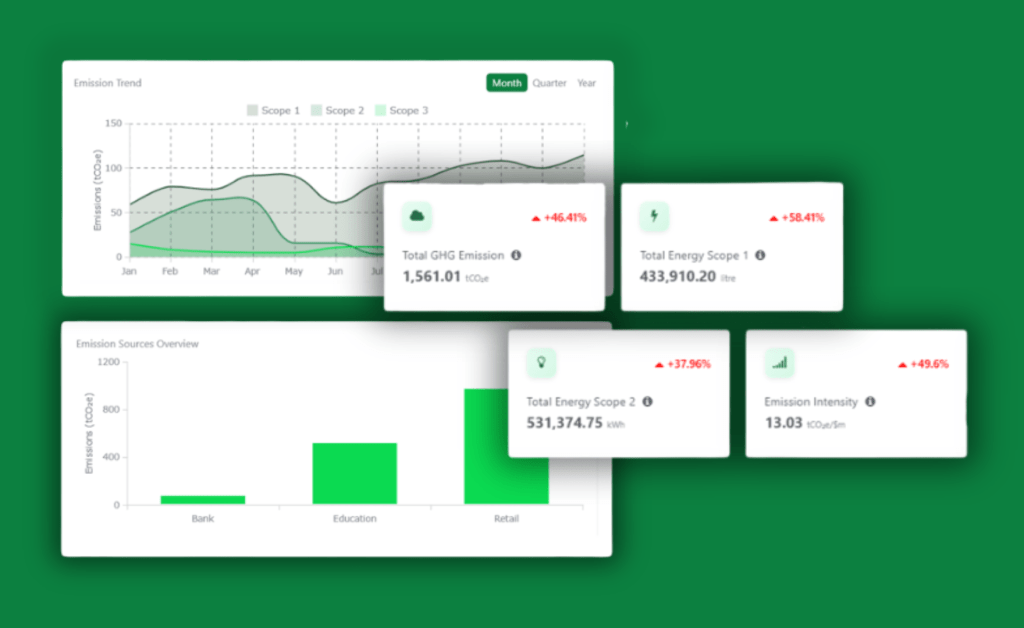
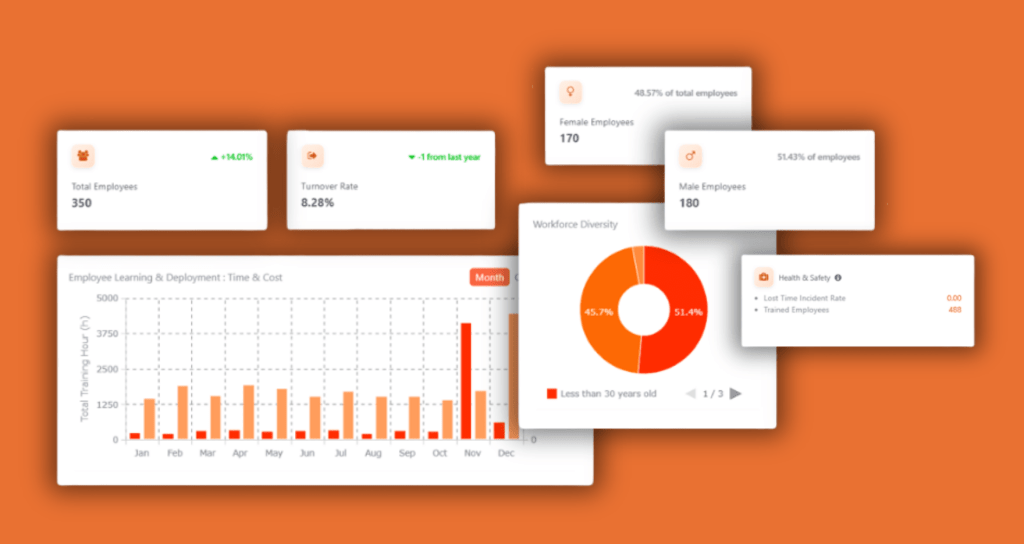
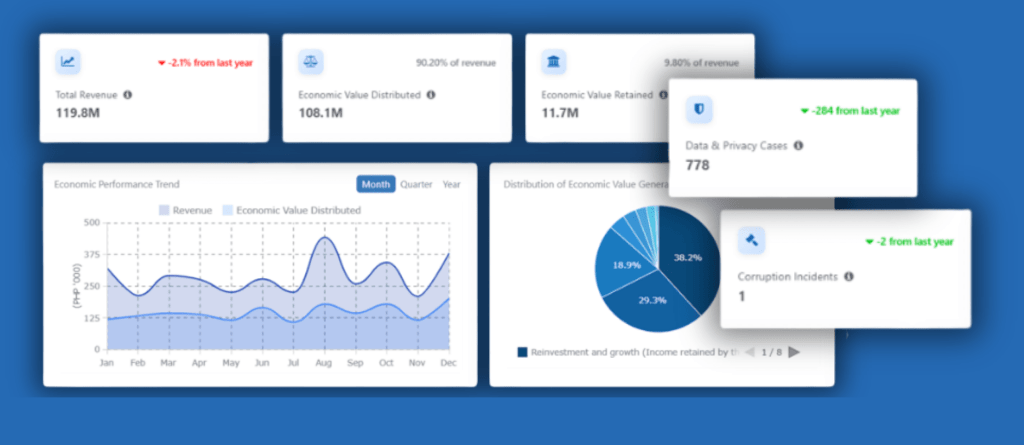
View real-time ESG metrics and KPIs through dynamic charts, pie graphs, and color-coded status grids showing overall corporate sustainability health

Trend Analysis

Compare historical data to track progress and spot changes in emission trajectories and performance over months or years

Business Unit Comparison

Visual dashboard to compare ESG performance across departments, sites, or branches

Data-Driven Decisions

Indicators (red / green) show which areas need attention for action

Track Environmental Performance in Real Time

Monitor emissions, energy usage, and key ESG metrics across your organisation.

Monitor Workforce & Social Impact

Track employee data, diversity, and social performance across departments.

Strengthen Governance & Oversight

Gain visibility into governance metrics, financial performance, and compliance indicators.

TellUS Report in Action

See how a sustainability manager used real-time visual dashboards to instantly spot an energy spike at a remote factory and fix it before the quarter ended.

Ready to elevate your ESG reporting game?
Tell us your needs.